Lost and Found
Lesson Plans & Technical Steps
1. Shape
1A. p5.js canvas coordinates
By default, every new p5.js sketch you create on the p5.js Editor will contain the following code:
function setup(){
  createCanvas(400,400);
}
The createCanvas() feature enables you to set the width and height of the canvas. This will determine the physical limit of your drawing surface. Try updating the numbers in between the parentheses in the following sequence, click the Play button, and see what happens:
function setup(){
  createCanvas(600,400);
}
function setup(){
  createCanvas(400,600);
}
function setup(){
  createCanvas(600,600);
}
Mini-Challenge: Can you tell which value determines the canvas width and which value determines the canvas height?
Tip: Similar to the logic of image editing software, you can only create one canvas per sketch. Additionally, it’s not possible to animate canvas size while a sketch is playing.
1B. p5.js coordinate system
We’re on our way to placing shapes on the canvas. Do you recall the Cartesian coordinate system taught in math classes? Don’t worry, we believe this to be much simpler! The p5.js canvas features an invisible coordinate system that originates from an X position of 0 and a Y location of 0 in the top-left corner.

As a shape on the canvas moves to the right of this point, its X-coordinate value increases. As an object on the canvas moves down from this point, its Y-coordinate value rises.
Code Snippet: Explore the p5.js coordinate system with this pixel ruler tool created by Alp Tugǎn, a p5.js Contributor.
1C. Drawing simple shapes
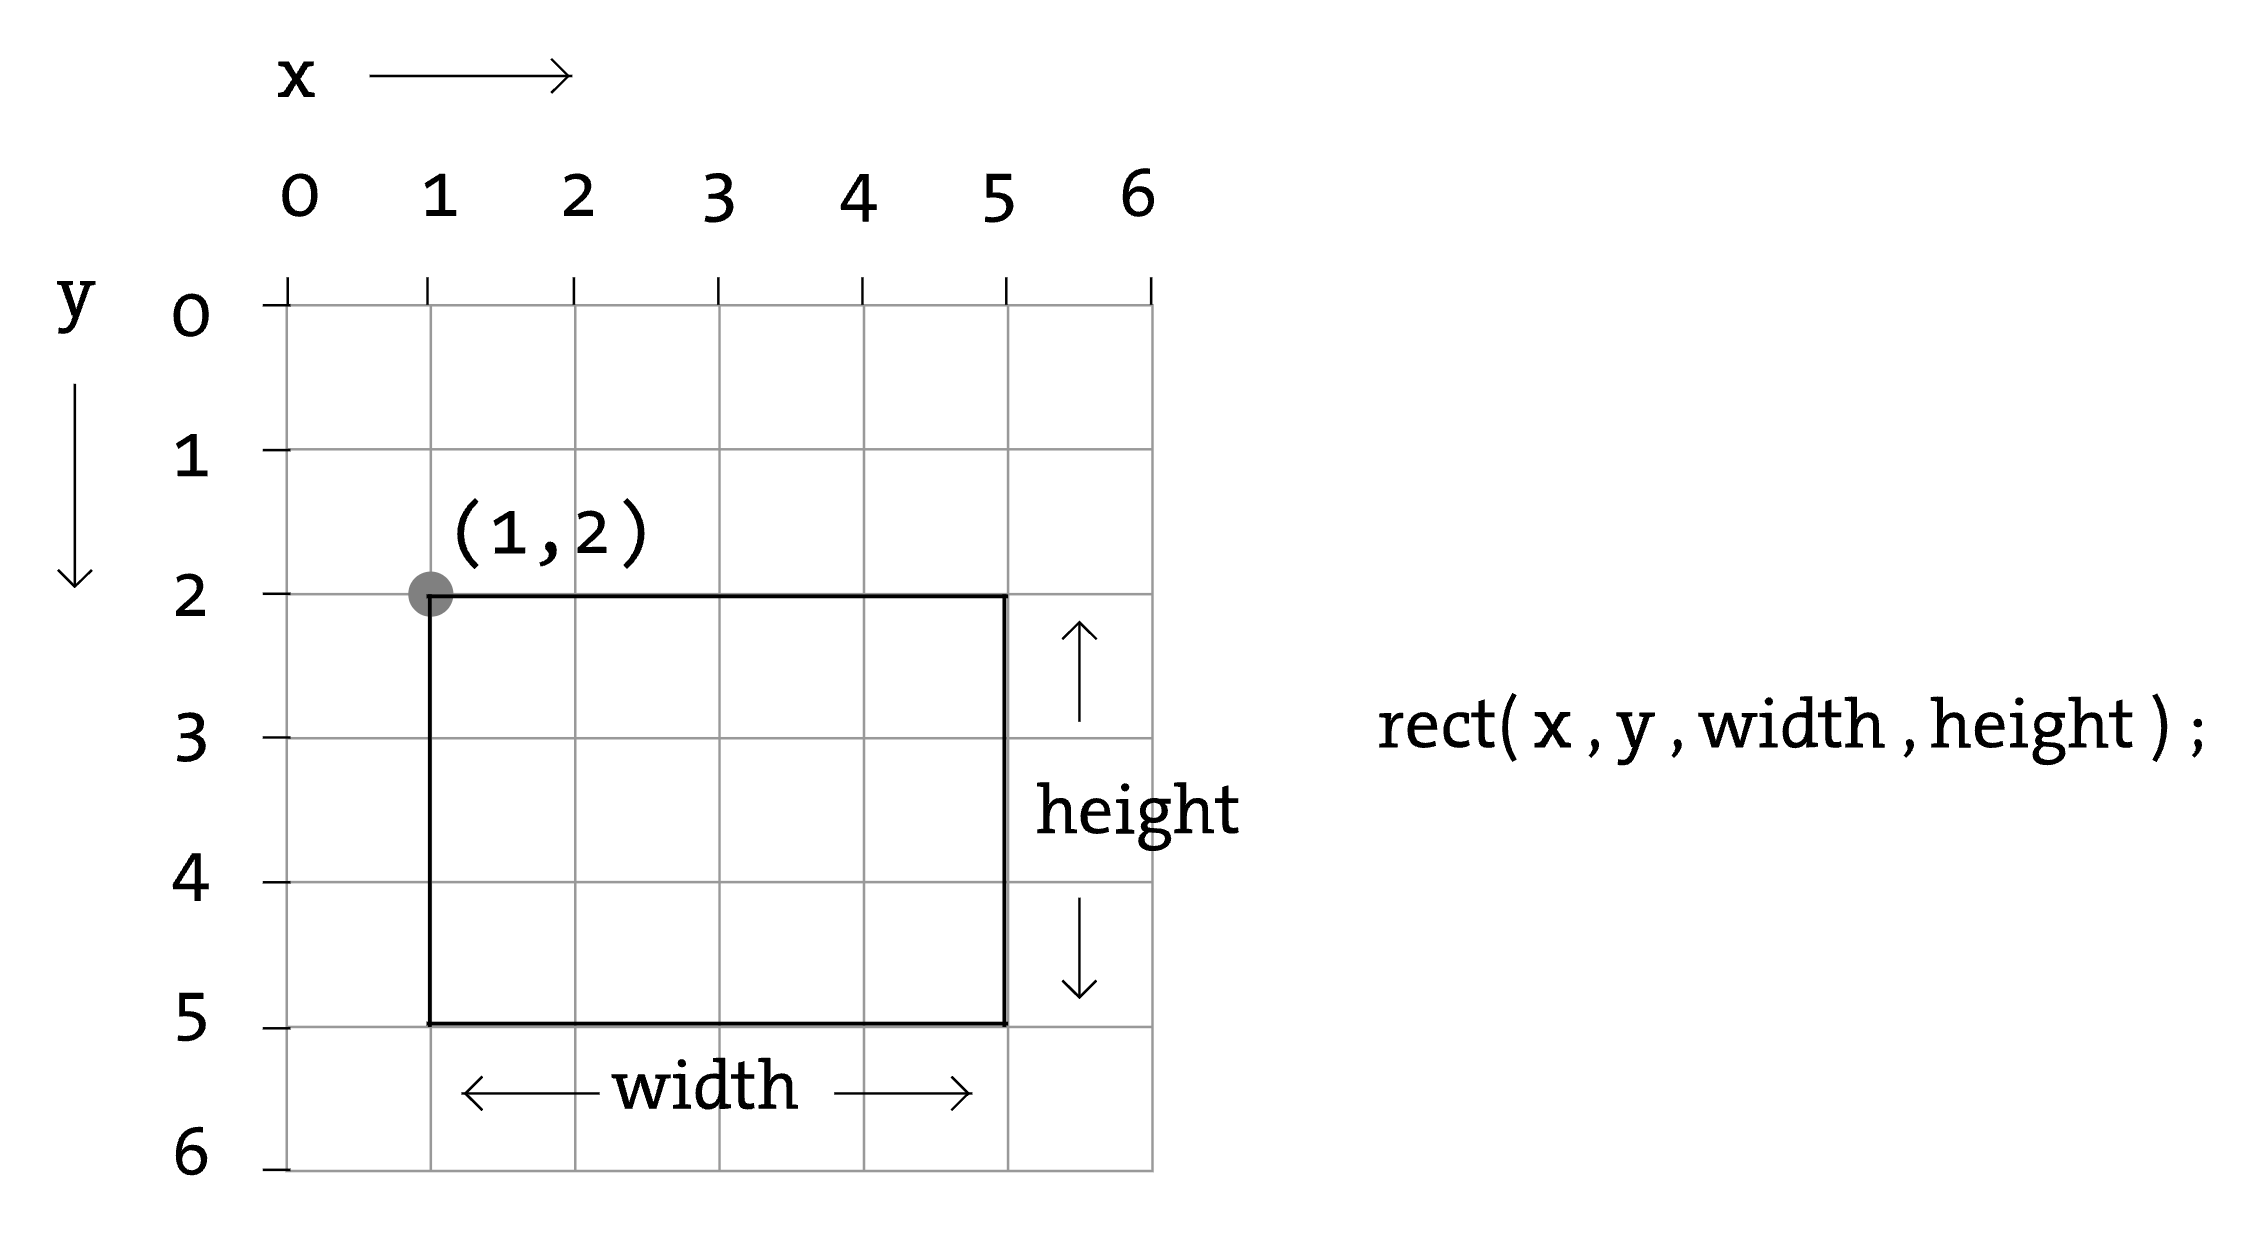
Now that we’ve covered the basics of the coordinate system, let’s draw a rectangle on the canvas by using the rect() feature!
function setup() {
  createCanvas(400, 400); // w, h
}

function draw() {
  background(220);
  rect(0, 0, 40, 40); // x, y, w, h
}
Code Snippet: Single rect().
You should see an adorable white rectangle appearing in the upper-left corner of the canvas. Digging deeper into the syntax of rect(), we’d learn that within the parentheses, the first number sets the X position; the second number sets the Y position; the third number sets the width; and the fourth number sets the height of the rectangle.
Now, add a couple more rectangles to the canvas. You’re invited to experiment with different x, y, width, and height values. Go wild!
function setup() {
  createCanvas(400, 400); // w, h
}

function draw() {
  background(220);
  rect(0, 0, 40, 40); // x, y, w, h
  rect(40, 40, 40, 40); // x, y, w, h
  rect(80, 80, 40, 40); // x, y, w, h
}
Code Snippet: Multiple rect().
Mini-Challenge: The example above uses rectangles to form the start of a diagonal line. Can you complete it so that the diagonal line extends across the entire canvas to reach the bottom-right corner?
Once you feel more comfortable with drawing rectangles on canvas, we’ll switch over to drawing ellipses using the ellipse() feature. In coding, it’s always a good idea to start small. So let’s begin by drawing a single ellipse on the canvas:
function setup() {
  createCanvas(400, 400); // w, h
}

function draw() {
  background(220);
  ellipse(0, 0, 40, 40); // x, y, w, h
}
Code Snippet: Single ellipse().
Hmmm… 🤔 Even though I’m trying to align the ellipse with the upper-left corner by setting X and Y to 0, it’s not behaving as expected. It is as if the edge of the canvas is cutting off the ellipse, and we’re only seeing a quarter of the shape. Why is this happening?
It turns out that in computer graphics, rectangles and ellipses have different anchor points:

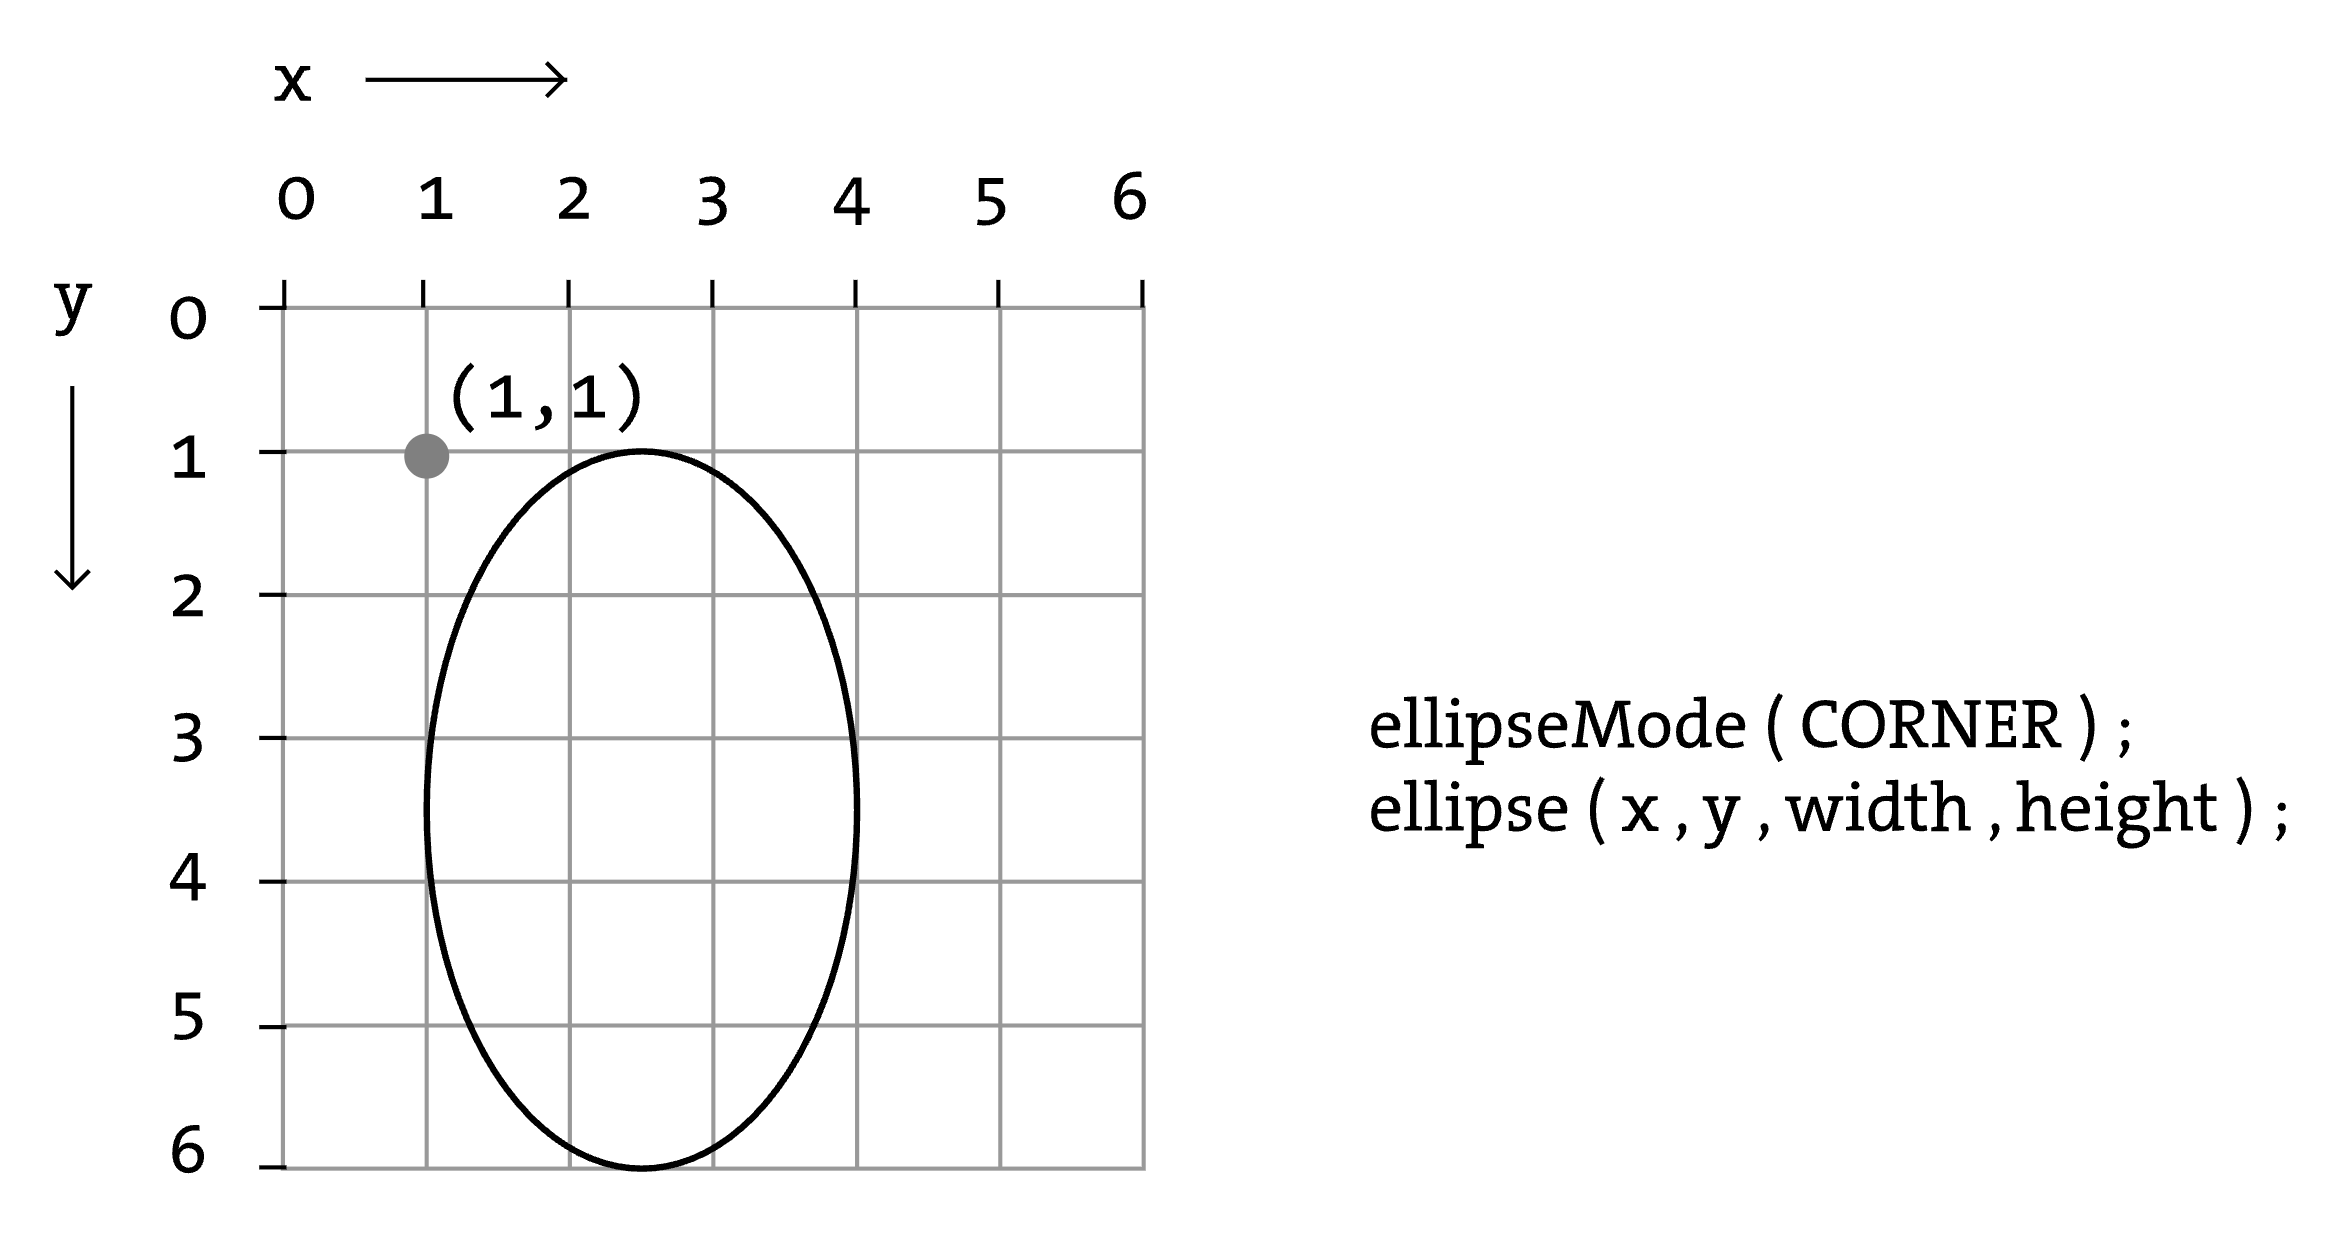
The rectangle’s anchor point is on the upper left corner, and the ellipse’s anchor point is in the center of the shape.

If you want to set the anchor point for ellipses to the upper-left corner, you can add the ellipseMode() feature and set it to CORNER.
function setup() {
  createCanvas(400, 400); // w, h
  ellipseMode(CORNER);
}

function draw() {
  background(220);
  ellipse(0, 0, 40, 40); // x, y, w, h
}
Code Snippet: ellipseMode().
Tip: Alternatively, if you want to set the anchor point for rectangles to the center, you can use the rectMode() feature and set it to CENTER.
After adding the ellipseMode() feature, your ellipse should be aligned to the upper-left corner. Now, let’s combine this drawing with the rectangle we drew:
function setup() {
  createCanvas(400, 400); // w, h
  ellipseMode(CORNER);
}

function draw() {
  background(220);
  ellipse(0, 0, 40, 40); // x, y, w, h
  rect(0, 0, 40, 40); // x, y, w, h
}
Something is not quite right. We’ve drawn both ellipse() and rect(), but the rectangle is the only visible shape on the canvas. What happens if we switch the order of the ellipse() and rect() code?
function setup() {
  createCanvas(400, 400); // w, h
  ellipseMode(CORNER);
}

function draw() {
  background(220);
  rect(0, 0, 40, 40); // x, y, w, h
  ellipse(0, 0, 40, 40); // x, y, w, h
}
Code Snippet: ellipse() + rect().
The ellipse should now be sitting on top of your rectangle. What this tells us is that the order in which you code your shapes matters. p5.js is built on JavaScript, and JavaScript renders code on the fly from top to bottom. Coding the rectangle first means that the rectangle is drawn first, and then it gets covered by the ellipse, which comes later.
2. Color
Grade 6~8
2A. Story Behind the Screen
Look at the screen in front of you right now. Every color you see—bright pinks, glowing greens, stormy blues—is made from just three colors of light: red, green, and blue—also known as RGB.
You can’t always see it, but it’s true. If you looked at your phone or computer screen under a microscope (cool science class moment!), you’d see tiny red, green, and blue lights—called pixels—turning on and off in different combinations. That’s how screens make color: by mixing light.
![]()
This kind of color mixing is called additive color. It’s different from mixing paint, where adding more makes things darker. With light, adding more actually make things brighter.

In this topic, we’ll learn to cast some color spells together using code. You’ll learn how to control the RGB colors in p5.js, a creative coding environment made for artists, designers, and anyone curious about how code can be expressive.
2B. Meet RGB
Let’s start by updating the background() in the p5.js editor:
function setup() {
  createCanvas(400, 400);
}

function draw() {
  background(255, 0, 0);  // r, g, b
}
If you click the Play button, the background of the canvas should be filled in bright red. Let’s break this down to better understand what’s going on:
- RGB ranges from a minimum value of 0, to a maximum value of 255. These numbers control the brightness levels of the red, green, and blue lights.
- In this case, the sketch is coloring the background in the brightest possible red in RGB.
background(255, 0, 0);means: full red light, no green light, and no blue light.
Mini-Challenge: Can you update background() to fill the canvas with the brightest blue possible?
Tip: In the RGB world, background(255, 255, 0); creates yellow, background(255, 0, 255); creates magenta, and background(0, 255, 255); creates cyan.
Play around! What happens with:
background(255, 255, 255)?background(0, 0, 0)?
Tip: If you only type one number like background(150), it fills the background with a shade of gray. That’s a shortcut for background(150, 150, 150).
2C. Filling Shapes with Color
Let’s add an ellipse and give it color using the fill() feature:
function setup() {
  createCanvas(400, 400); // w, h
  rectMode(CENTER);
}

function draw() {
  background(220);
  fill(255, 255, 0); // r, g, b
  rect(200, 200, 40, 40); // x, y, w, h
  ellipse(200, 200, 40, 40); // x, y, w, h
}
By default, fill() recognizes RGB values and sets the color of the shapes you draw. But what if you want to fill the ellipse with a different color? You will need to place another fill() right before the ellipse.
function setup() {
  createCanvas(400, 400); // w, h
  rectMode(CENTER);
}

function draw() {
  background(220);
  fill(255,255,0); // r, g, b
  rect(200, 200, 40, 40); // x, y, w, h
  fill(255,0,255); // r, g, b
  ellipse(200, 200, 40, 40); // x, y, w, h
}
Code Snippet: fill().
Once you feel comfortable with using RGB colors, you have the option of going further by adding a fourth number to fill() to make something see-through!
fill(255, 0, 0, 100); // r, g, b, alpha
The last number is called the alpha value. It also ranges from 0 (fully transparent) to 255 (fully opaque).
Mini-Challenge: Try overlapping shapes with different alpha values. What kinds of layering effects can you make?
2D. Draw your favorite snack
Let’s use everything you’ve learned so far to draw a snack you love. Think about ways you could represent your snack using 2D primitives like ellipses and rectangles. And instead of guessing the RGB values of a color you want to use, play around with this color picker to choose specific colors. Below is an example of a lollipop:
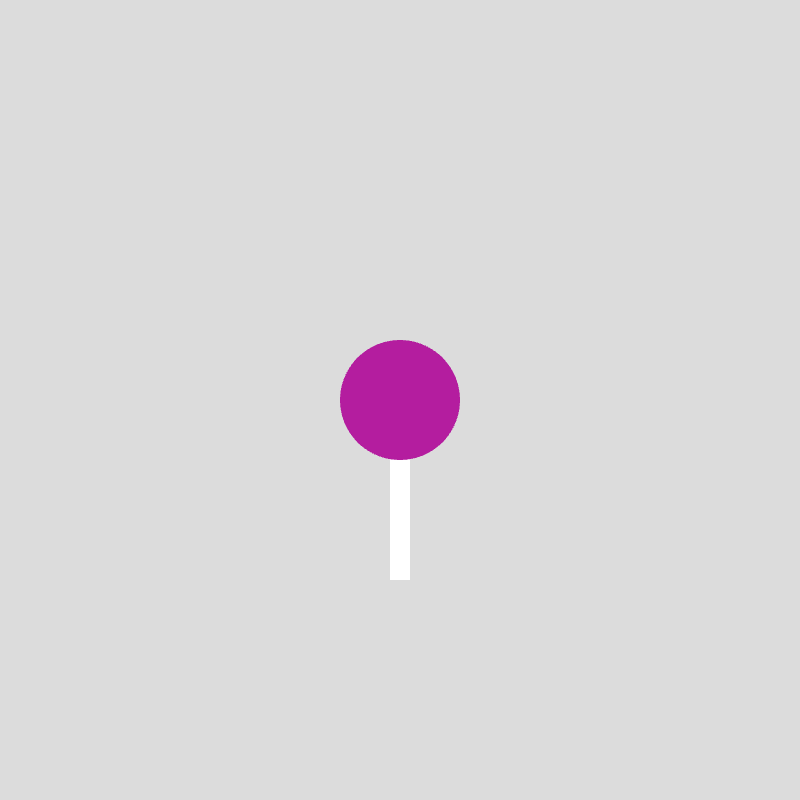
Code Snippet: lollipop example.
Tip: Adding noStroke() removes the black outline around shapes. stroke() sets the outline to a different color. strokeWeight() alters the thickness of the outline.
Grade 9~12
3. Blend Modes
Want your colors to mix in cool ways—like in Photoshop or Instagram filters? Try this:
function setup() {
  createCanvas(400, 400);
  blendMode(LIGHTEST);  // Try other modes: DARKEST, MULTIPLY, DIFFERENCE

  fill(255, 0, 0);
  ellipse(150, 200, 200, 200);

  fill(0, 0, 255);
  ellipse(250, 200, 200, 200);
}
Blend modes change how colors mix when they overlap. Each one creates different visual effects.