Participatory Cartography
Introduction
How can p5.js be used to create collaborative maps that reflect the diverse experiences and perspectives of a community?
Participatory cartography is a collaborative process in which individuals or communities actively contribute to the creation of maps that represent their own knowledge, experiences, and perspectives. Unlike traditional mapping methods, which are often created by “experts” or organizations with top-down perspectives, participatory mapping emphasizes local input and involvement, aiming to empower communities and make maps more reflective of diverse viewpoints.
Related spheres: human geography, critical cartography, spatial data justice, sensory and emotional geographies
References & Artworks for Discussion
- Christian Nold, Staple Hill Walking Map & New Oak Walking Map
- Avery Gordon et al., An Atlas of Radical Cartography
- Katharine Harmon, The Map As Art: Contemporary Artists Explore Cartography
- Katharine Harmon, You Are Here: Personal Geographies and Other Maps of the Imagination
- Kris Harzinski, From Here to There: A Curious Collection from the Hand Drawn Map Association
- Kollektiv Orangotango (ed.), This is Not an Atlas: A Global Collection of Counter-Cartographies
- Laurie H. Rubel et al., Making Space for Place: Mapping Tools and Practices to Teacher for Spatial Justice
References & Artworks Discussion Questions
- How do these works challenge or expand traditional notions of what a map is?
- What role does storytelling play in these maps, and how does it impact your understanding of the places they depict?
- How do these maps engage with the concepts of power, representation, and visibility and/or function as tools of activism or resistance?
- What role does collaboration play in the creation and interpretation of these maps?
Let’s make a Participatory Map!
Example completed sketch: Participatory Mapping Sample Shared Map
The Activities
- ⏰ Each activity will take approximately 60 minutes
- 5️⃣ Activities
- 🔗 Link to the sample project: Participatory Mapping Sample Shared Map
Activity 1: Creating the Shared Map Template (Teacher)
In this activity, the teacher will write a p5.js sketch to display a map (an image file) as the background of your canvas (a drawing space). You’ll be introduced to key p5.js concepts like loading images, functions, shapes, text, and the basic structure of a p5.js sketch. At the end of this activity, you will have a Shared Map Template that you will share with students.
Relevant p5.js Functions
- preload()
- Runs once to load our assets before the sketch runs.
- loadImage()
- We are using loadImage( ) inside preload( ) to load the image of our map.
- setup()
- Runs once when our sketch starts running.
- creativeCanvas()
- We are using createCanvas inside setup( ) to load the canvas upon which our map will be drawn
- draw()
- Called repeatedly while the sketch runs.
- background()
- We are using background( ) to set our map image as the background of our canvas.
- textSize()
- We are using textSize( ) to set the size of the text for our pop-up descriptions.
- textAlign()
- We are using textAlign( ) to align our pop-up description text to the left.
- textWrap()
- We are using textWrap( ) with the parameter style WORD to start a new line of text at spaces so it doesn’t overflow the text box.
- textFont()
- We are using textFont( ) to set the font of our pop-up descriptions.
- fill()
- We are using fill( ) to set the color to fill our pop-up descriptions box.
- rect()
- We are using rect( ) to draw our pop-up descriptions box.
- text()
- We are using text( ) to draw the text of our descriptions.
Steps:
Prepare & Upload Map Image
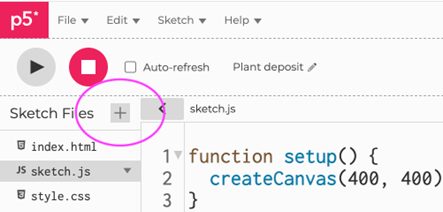
- If you haven’t already, go to the p5.js Web Editor and create a free account.
- Prepare your map image:
- Find or create an image of your map. Think about what the scope of your map will be and how much area you want it to cover. For my example map, I used Stadia Maps’ Build a Map Tool, where you can customize the look of your map image to fit your project.
- Load your image to your sketch. Images can be loaded directly into your p5.js sketch on the Editor, using the “+” button next to your sketch files.
- In p5.js, every sketch has two main parts (which will already be there when you start a new sketch):
- setup( ): Runs once at the beginning to set up with canvas or initial settings.
- Inside setup( ) is createCanvas( ), which creates the drawing area where everything will appear. The numbers are the width and height of the canvas in pixels.
- draw( ): Runs repeatedly to render the visuals on the canvas.
- Inside draw( ) is background( ) which fills the canvas with a color or an image.
- setup( ): Runs once at the beginning to set up with canvas or initial settings.
//This is the starter code when you open a new p5.js sketch
function setup() {
createCanvas(600, 400);
}

function draw() {
background(220);
}
Preload Map Image
Images take time to load, so we can use a preload( ) function to ensure the image is loaded and ready before the program runs:
- Create a variable to store the image (in the example, the variable is named schoolMap, but you should choose a variable name that describes your map image).
- Add the preload( ) function which is a special function in p5.js that runs before setup( ) to load files like images or fonts.
- Inside preload( ) use a loadImage( ) function to load your image.
function preload() {  //Add a preload function to preload your image
schoolMap = loadImage(‘bwmap.png’); //Put your image filename inside loadImage()
}

function setup() {
createCanvas(600, 400);
}

function draw() {
background(220);
}
Draw Map Background
Make the background your map image:
- Change the number inside background( ) to the name of the variable storing your map image. This will replace the solid color background with the image of your map.
- Change the width and height parameters inside the createCanvas( ) function to match the width and height of your map image by using your map image variable name with .width or .height.
let schoolMap;

function preload() {
  schoolMap = loadImage(‘bwmap.png’);
}

function setup() {
  createCanvas(schoolMap.width, schoolMap.height); //set canvas to match size of your map image
}

function draw() {
  background(schoolMap); //Insert the name of the variable storing your map image
}
Set Standardized Text Properties
Add standard text properties that students will use for their artifact descriptions:
- Add textSize( ) function to set a standard font size for all students
- Add textAlign( ) function to align the description text consistently
- Add textWrap( ) function to wrap the text to the next line if it exceeds the width of the text box
- Add textFont( ) function to set a standard font for all students
let schoolMap;

function preload() {
  schoolMap = loadImage(‘bwmap.png’);
}

function setup() {
  createCanvas(schoolMap.width, schoolMap.height);
  textSize(16); //set standard text size for student artifact descriptions
  textAlign(LEFT,TOP); //align text for student artifact descriptions to the top left
  textWrap(WORD); //set standard text size for student artifact descriptions
  textFont(‘Comic Sans MS’); //set standard font for student artifact descriptions
}

function draw() {
  background(schoolMap);
}
Create Function to Draw Text Box
Below the draw() function, create a function to draw the description text box:
- Create a function called drawTextBox that takes three parameters: x, y, and description
- Use fill() to set the textbox color you want
- Use rect() to draw the text box at a standard size
- Use fill() to set the text color you want (make sure it will be readable on top of the text box color)
- Use text() to draw the description text inside the box
let schoolMap;

function preload() {
  schoolMap = loadImage(‘bwmap.png’);
}

function setup() {
  createCanvas(schoolMap.width, schoolMap.height);
  textSize(16);
  textAlign(LEFT,TOP);
  textWrap(WORD);
  textFont(‘Comic Sans MS’);
}

function draw() {
  background(schoolMap);
}

function drawTextBox(x, y, description) {
  fill(0); //Set background color of text box
  rect(x, y, 180, 80); //Draw a rectangle 180 pixels wide and 80 pixels tall

  fill(255); //Set text color for artifact descriptions
  text(description, x + 5, y + 5, 180, 80); //Draw the description text inside the box, a little away from the edges
}
Test & Debug
- Run your code by pressing the play button in the p5.js Web Editor and verify that your map image appears on the canvas as you wish it to.
Activity 2: Prepare & Place Artifacts (Students)
In this lesson, each student will prepare their artifact and add it to their own copy of the Base Map Template at the appropriate location (we will combine all the artifacts into one shared map in Activity 5).
New p5.js Functions
- image()
- We are using image( ) to set the size and location of student artifacts on the map.
Steps:
Prepare and Load Artifact
- First students must create their artifacts. Depending on the goals for your map, this might be taking digital photos, creating digital drawings, or creating hand-drawings that are then scanned.
- To remove the background of your artifact, save the file as a .png image and then use a free tool like remove.bg or a paid tool like Canva or Photoshop to remove the background.
- If they haven’t already, have students go to the p5.js Web Editor and create a free account.
- Share the link to the Shared Map Template you created in Activity 1 with your students and have them duplicate it (File→Duplicate) and save the copy to their account. This will give each student a standard background template to work off of.
- Now each student can upload their artifact image to the p5.js Editor, using the “+” button next to the sketch files.
Place Artifact on Map
- Images take time to load, so we can use preload( ) to ensure the image is loaded and ready before the program runs. Each student should:
- Create a variable to store their artifact image. For ease of merging into one shared map in Activity 5, ask students to use a consistent variable name for their artifact(s) such as name_artifact (using their name and a one-word descriptor of their artifact).
- Inside preload( ) use loadImage( ) to load artifact image.
- Use the image( ) function to display your artifact on the map:
- Add an image() function inside the draw() function and customize the Inside the following parameters (in this order):
- The name of the variable storing the artifact image
- The x coordinate of where the artifact should be placed on the canvas
- The y coordinate of where the artifact should be placed on the canvas
- The width you’d like the artifact to appear (provide a width range, for example 70-80, for students to ensure consistent sizing)
- The height you’d like the artifact to appear (provide a height range, for example 70-80, for students to ensure consistent sizing)
- Add an image() function inside the draw() function and customize the Inside the following parameters (in this order):
let schoolMap;
let studentA_artifact; //Add a variable to store your artifact using a standard naming convention provided by the teacher.

function preload() {
  schoolMap = loadImage(‘bwmap.png’);
  studentA_artifact = loadImage(‘studentA_artifact.png’); //preload your image
}

function setup() {
  createCanvas(schoolMap.width, schoolMap.height);
  textSize(16);
  textAlign(LEFT,TOP);
  textWrap(WORD);
  textFont(‘Comic Sans MS’);
}

function draw() {
  background(schoolMap);
  image(studentA_artifact, 200, 150, 75, 75); //(name of variable storing your
artifact image, x, y, width, height)
}

function drawTextBox(x, y, description) {
  fill(0);
  rect(x, y, 180, 80);

  fill(255);
  text(description, x + 5, y + 5, 180, 80);
}
Test, Debug, and Customize
- Run your code by pressing the play button in the p5.js Web Editor and verify that your artifact image appears on the canvas.
- Customize the x and y coordinates and the width and height of the artifact image until it displays at the appropriate location and size.
Activity 3: Add Description & Mouse Interactivity (Students)
In this lesson, each student will add a pop-up description for their artifact(s) to their own copy of the Shared Map Template at the appropriate location near their artifact. They will set the description text box to appear when a user clicks their mouse on the artifact image and disappear when the mouse is released.
New p5.js Functions
- mousePressed()
- We are using mousePressed( ) to open up our pop-up description when an artifact is being clicked.
- mouseReleased()
- We are using mouseReleased( ) to close our pop-up description when the artifact is not being clicked.
Steps:
Create Variables
- Add a variable to store the description. Provide students with a maximum word count of ~15 for their descriptions so they don’t overflow the description box size. You will also want to have students use a standard naming convention, such as name_artifact_description (using their name and a one-word descriptor of their artifact) for ease of merging into one shared map in Activity 5.
- Add a variable to determine whether the description is visible. This variable will toggle between true (text box is visible) and false (text box is hidden) when the mouse is clicked and released. Again, you will want to have students use a standard naming convention, such as showText_artifact (using a one-word descriptor of their artifact) for ease of merging into one shared map in Activity 5.
let schoolMap;
let studentA_artifact;
let studentA_artifact_description = “One sentence describing the artifact.”; //Add a variable to store your artifact description of 15 words or less.
let showText_artifact = false; //Initially, your pop up description is not visible.

function preload() {
  schoolMap = loadImage(‘bwmap.png’);
  studentA_artifact = loadImage(‘studentA_artifact.png’);
}

function setup() {
  createCanvas(schoolMap.width, schoolMap.height);
  textSize(16);
  textAlign(LEFT,TOP);
  textWrap(WORD);
  textFont(‘Comic Sans MS’);
}

function draw() {
  background(schoolMap);
  image(studentA_artifact, 200, 150, 75, 75);
}

function drawTextBox(x, y, description) {
  fill(0);
  rect(x, y, 180, 80);

  fill(255);
  text(description, x + 5, y + 5, 180, 80);
}
Add Conditional Statement
Inside the draw() function, just after drawing their artifact image:
- Add a conditional block to check whether showText_artifact is true or false
- If it is true, call the drawTextBox() function and customize the parameter to:
- An x and y location near the artifact
- The name of the variable storing the artifact description
let schoolMap;
let studentA_artifact;
let studentA_artifact_description = “One sentence describing the artifact.”;
let showText_artifact = false;

function preload() {
  schoolMap = loadImage(‘bwmap.png’);
  studentA_artifact = loadImage(‘studentA_artifact.png’);
}

function setup() {
  createCanvas(schoolMap.width, schoolMap.height);
  textSize(16);
  textAlign(LEFT,TOP);
  textWrap(WORD);
  textFont(‘Comic Sans MS’);
}

function draw() {
  background(schoolMap);
  image(studentA_artifact, 200, 150, 75, 75);

  if (showText_artifact) { //Add if condition block to check the value of the showText_artifact variable and see if it is true or false.
    drawTextBox(100, 70, studentA_artifact_description); //draw text box near the artifact (x, y, description variable)
  }
}

function drawTextBox(x, y, description) {
  fill(0);
  rect(x, y, 180, 80);

  fill(255);
  text(description, x + 5, y + 5, 180, 80);
}
Display Description When Artifact Clicked
Use mousePressed( ) to Activate the Text Box:
- Add a mousePressed( ) function to detect when the artifact is clicked.
- Set the x and y coordinates to match the position and size of your artifact from your image( ) function in draw( ).
- Set the condition to check whether the mouse being pressed is within the artifact’s area, and if the condition is true, the program sets showText_artificat to true, making the description visible.
let schoolMap;
let studentA_artifact;
let studentA_artifact_description = “One sentence describing the artifact.”;
let showText_artifact = false;

function preload() {
  schoolMap = loadImage(‘bwmap.png’);
  studentA_artifact = loadImage(‘studentA_artifact.png’);
}

function setup() {
  createCanvas(schoolMap.width, schoolMap.height);
  textSize(16);
  textAlign(LEFT,TOP);
  textWrap(WORD);
  textFont(‘Comic Sans MS’);
}

function draw() {
  background(schoolMap);
  image(studentA_artifact, 200, 150, 75, 75);

  if (showText_artifact) {
    drawTextBox(100, 70, studentA_artifact_description);
  }
}

function drawTextBox(x, y, description) {
  fill(0);
  rect(x, y, 180, 80);

  fill(255);
  text(description, x + 5, y + 5, 180, 80);
}

function mousePressed() { //Detect when artifact is clicked
    if (mouseX > 200 && mouseX < 275 && mouseY > 15 && mouseY <225) {
       showText_artifact = true; //If it is, set showText_artifact variable value to true.
    }
}
Hide Description When Mouse is Released
Add mouseReleased( ) Function:
- Add another function to hide the text box when the mouse is released.
- When the mouse button is released, the program sets showText back to false, hiding the description.
let schoolMap;
let studentA_artifact;
let studentA_artifact_description = “One sentence describing the artifact.”;
let showText_artifact = false;

function preload() {
  schoolMap = loadImage(‘bwmap.png’);
  studentA_artifact = loadImage(‘studentA_artifact.png’);
}

function setup() {
  createCanvas(schoolMap.width, schoolMap.height);
  textSize(16);
  textAlign(LEFT,TOP);
  textWrap(WORD);
  textFont(‘Comic Sans MS’);
}

function draw() {
  background(schoolMap);
  image(studentA_artifact, 200, 150, 75, 75);

  if (showText_artifact) {
    drawTextBox(100, 70, studentA_artifact_description);
  }
}

function drawTextBox(x, y, description) {
  fill(0);
  rect(x, y, 180, 80);

  fill(255);
  text(description, x + 5, y + 5, 180, 80);
}

function mousePressed() { //Detect when artifact is clicked
    if (mouseX > 200 && mouseX < 275 && mouseY > 15 && mouseY <225) {
       showText_artifact = true;
    }
}

function mouseReleased() { //Detect when mouse is released
       showText_artifact = false; //If mouse released, set showText_artifact variable value to false.
}
Test and Debug
- Run your code and verify that when you click the artifact with your mouse, the pop up box with their description appears near their artifact.
- Release the mouse and the text box should disappear.
Activity 4: Animating Artifacts on the Map (Students)
In this lesson, students will learn how to animate their artifacts using one of several animation techniques: bouncing, moving left-to-right, color change, grow/shrink, or rotation. We will explore the logic behind different types of animations, and implement at least one animation style to their own artifact.
New p5.js Functions
- tint()
- We are using tint() to tint the color of an artifact in the color change animation option.
- noTint()
- We are using noTint( ) to restore an artifact image to its original colors in the color change animation option.
- translate()
- We are using translate( ) to move the origin point to the center of the artifact image in the rotation animation option.
- rotate()
- We are using rotate( ) to rotate the artifact around the origin point in the rotation animation option.
- radians()
- We are using radians() to convert degrees to radians in the rotation animation option.
Steps:
Animation Option 1: Bouncing Up and Down
- Add variables before the preload( ) function:
- Add a variable to store the Y position of the artifact and set it to the current Y coordinate of the artifact image.
- Add a variable to store the speed of the artifact.
- Add a variable to store the direction of the artifact.
- Update the draw( ) function (after drawing the background map but before drawing the artifact image) to include:
- Update the y position of the artifact to speed * direction to move the artifact up and down.
- Add an if condition code block to check if the artifact has reached the boundaries. (You will need to customize the boundaries to keep your artifact near its starting location).
- If the artifact has reached the boundaries, update the direction variable value to reverse the direction by multiplying the value by -1.
let schoolMap;
let studentA_artifact;
let studentA_artifact_description = “One sentence describing the artifact.”;
let showText_artifact = false;

let studentA_artifact_YPos = 150; //Create variable to store artifact Y position and set it to start at the current Y position
let studentA_artifact_speed = 0.1; //Create variable to store the speed of the bounce
let studentA_artifact_direction = 1; //Create variable to store the direction of bounce

function preload() {
  schoolMap = loadImage(‘bwmap.png’);
  studentA_artifact = loadImage(‘studentA_artifact.png’);
}

function setup() {
  createCanvas(schoolMap.width, schoolMap.height);
  textSize(16);
  textAlign(LEFT,TOP);
  textWrap(WORD);
  textFont(‘Comic Sans MS’);
}

function draw() {
  background(schoolMap);

  studentA_artifact_YPos += studentA_artifact_speed * studentA_artifact_direction //change artifact y position by speed * direction
  if (studentA_artifatct_YPos >= 180 || studentA_artficat_YPos <= 120){ //check to see if artifact has reached top or bottom boundary
      studentA_artifact_direction *= -1; //If so, reverse bounce direction
  }

  image(studentA_artifact, 200, 150, 75, 75);

  if (showText_artifact){
    drawTextBox(100, 70, studentA_artifact_description);
  }
}

function drawTextBox(x, y, description) {
  fill(0);
  rect(x, y, 180, 80);

  fill(255);
  text(description, x + 5, y + 5, 180, 80);
}

function mousePressed() { //Detect when artifact is clicked
    if (mouseX > 200 && mouseX < 275 && mouseY > 15 && mouseY <225){
       showText_artifact = true;
    }
}

function mouseReleased() {
     showText_artifact = false;
}
Test and Customize
- Run your code by pressing the play button in the p5.js Web Editor and verify that your artifact bounces.
- Customize your artifact boundaries and artifact speed to your preferences.
Animation Option 2: Horizontal Movement
- Add variables before the preload( ) function:
- Add a variable to store the X position of the artifact and set it to the current X coordinate of the artifact image.
- Add a variable to store the speed of the artifact.
- Add a variable to store the direction of the artifact.
- Update the draw( ) function (after drawing the background map but before drawing the artifact image) to include:
- Update the x position of the artifact to speed * direction to move the artifact side to side.
- Add an if condition code block to check if the artifact has reached the boundaries. (You will need to customize the boundaries to keep your artifact near its starting location.)
- If the artifact has reached the boundaries, update the direction variable value to reverse the direction by multiplying the value by -1.
let schoolMap;
let studentA_artifact;
let studentA_artifact_description = “One sentence describing the artifact.”;
let showText_artifact = false;

let studentA_artifact_XPos = 200; //Create variable to store artifact x position and set it to start at the current x position
let studentA_artifact_speed = 0.2; //Create variable to store the speed of the movement
let artifact1_direction = 1; //Create variable to store the direction of movement

function preload() {
  schoolMap = loadImage(‘bwmap.png’);
  studentA_artifact = loadImage(‘studentA_artifact.png’);
}

function setup() {
  createCanvas(schoolMap.width, schoolMap.height);
  textSize(16);
  textAlign(LEFT,TOP);
  textWrap(WORD);
  textFont(‘Comic Sans MS’);
}

function draw() {
  background(schoolMap);

studentA_artifact_XPos += studentA_artifact_speed * studentA_artifact_direction //set the artifact in motion by multiplying speed * direction
  if (studentA_artifatct_XPos >= 225 || studentA_artficat_YPos <= 175){ //check to see if artifact has reached top or bottom boundary
      studentA_artifact_direction *= -1; //If so, reverse direction
  }

  image(studentA_artifact, 200, 150, 75, 75);

  if (showText_artifact){
    drawTextBox(100, 70, studentA_artifact_description);
  }
}

function drawTextBox(x, y, description) {
  fill(0);
  rect(x, y, 180, 80);

  fill(255);
  text(description, x + 5, y + 5, 180, 80);
}

function mousePressed() { //Detect when artifact is clicked
    if (mouseX > 200 && mouseX < 275 && mouseY > 15 && mouseY <225){
       showText_artifact = true;
    }
}

function mouseReleased() {
     showText_artifact = false;
}
Test and Customize
- Run your code by pressing the play button in the p5.js Web Editor and verify that your artifact moves horizontally.
- Customize your artifact boundaries and artifact speed to your preferences.
Animation Option 3: Color Change
- Add variables before the preload( ) function:
- Add a variable to store the color value of the artifact image.
- Add a variable to store the speed of the color change. Update the draw( ) function (after drawing the background map but before drawing the artifact image) to include:
- Update the draw( ) function (after drawing the background map but before drawing the artifact image) to include:
- Add the value of colorSpeed to the artifact color.
- Add an if condition code block to check if the color value has reached the boundaries and reverse color change direction. (Color boundaries are 0 and 255.)
- Add a tint( ) function to apply a tint to the artifact image color.
- Update the draw( ) function (after drawing the artifact image) to include:
- The noTint( ) function to reset the image to its original colors
let schoolMap;
let studentA_artifact;
let studentA_artifact_description = “One sentence describing the artifact.”;
let showText_artifact = false;

let studentA_artifact_XPos = 200; //Create variable to store artifact x position and set it to start at the current x position
let studentA_artifact_speed = 0.2; //Create variable to store the speed of the movement
let artifact1_direction = 1; //Create variable to store the direction of movement

function preload() {
  schoolMap = loadImage(‘bwmap.png’);
  studentA_artifact = loadImage(‘studentA_artifact.png’);
}

function setup() {
  createCanvas(schoolMap.width, schoolMap.height);
  textSize(16);
  textAlign(LEFT,TOP);
  textWrap(WORD);
  textFont(‘Comic Sans MS’);
}

function draw() {
  background(schoolMap);

  studentA_artifact_color += studentA_artifact_colorSpeed;//change the artifact color by the colorSpeed
  if (studentA_artifact_color >= 225 || studentA_artficat_color <= 0){ //check to see if artifact has reached the boundaries for color
      studentA_artificat_colorSpeed *= -1; //If so, reverse color change direction
  }
  tint(studentA_artifact_color, 100, 255 - studentA_artificat_color);//apply color tint to the artifact
  image(studentA_artifact, 200, 150, 75, 75);
  noTint(); //reset tint to original colors
 }

  if (showText_artifact){
    drawTextBox(100, 70, studentA_artifact_description);
}

function drawTextBox(x, y, description) {
  fill(0);
  rect(x, y, 180, 80);

  fill(255);
  text(description, x + 5, y + 5, 180, 80);
}

function mousePressed() { //Detect when artifact is clicked
    if (mouseX > 200 && mouseX < 275 && mouseY > 15 && mouseY <225){
       showText_artifact = true;
    }
}

function mouseReleased() {
     showText_artifact = false;
}
Test and Customize
- Run your code and verify that your artifact changes color.
- Customize your color change speed and tint to your preferences.
Animation Option 4: Growing and Shrinking
- Add variables before the preload( ) function:
- Add a variable to store the size of the artifact image.
- Add a variable to store the speed of the size change.
- Update the draw( ) function (after drawing the background map but before drawing the artifact image) to include:
- Add the value of sizeSpeed to the artifact size.
- Add an if condition code block to check if the artifact size has reached the boundaries and reverse between grow/shrink. (You will need to customize the size boundaries to stay within your artifact’s general area and not grow so big it will cover up other artifacts on the shared map in Activity 5.)
- Update the parameters existing image( ) function to include:
- Multiply width parameter by artifact size variable.
- Multiply height parameter by artifact size variable.
let schoolMap;
let studentA_artifact;
let studentA_artifact_description = “One sentence describing the artifact.”;
let showText_artifact = false;

let studentA_artifact_size = 1; //Create variable to store artifact size
let studentA_artifact_sizeSpeed = 0.001; //Create variable to store the speed of the size change

function preload() {
  schoolMap = loadImage(‘bwmap.png’);
  studentA_artifact = loadImage(‘studentA_artifact.png’);
}

function setup() {
  createCanvas(schoolMap.width, schoolMap.height);
  textSize(16);
  textAlign(LEFT,TOP);
  textWrap(WORD);
  textFont(‘Comic Sans MS’);
}

function draw() {
  background(schoolMap);

  studentA_artifact_size += studentA_artifact_sizeSpeed;//set the artifact size to start changing by adding the sizeSpeed
  if (studentA_artifact_size >= 1.1 || studentA_artifact_size <= 0.8){ //check to see if artifact has reached the boundaries for size
      studentA_artifact_sizeSpeed *= -1; //If so, reverse the growth direction
  }
  image(studentA_artifact, 400, 100, 100 * studentA_artifact_size, 100 * studentA_artifact_size); //Draw the artifact image at the current growth size

 }

  if (showText_artifact){
    drawTextBox(100, 70, studentA_artifact_description);
}

function drawTextBox(x, y, description) {
  fill(0);
  rect(x, y, 180, 80);

  fill(255);
  text(description, x + 5, y + 5, 180, 80);
}

function mousePressed() { //Detect when artifact is clicked
    if (mouseX > 200 && mouseX < 275 && mouseY > 15 && mouseY <225){
       showText_artifact = true;
    }
}

function mouseReleased() {
     showText_artifact = false;
}
Test and Customize
- Run your code by pressing the play button in the p5.js Web Editor and verify that your artifact grows and shrinks.
- Customize your growth boundaries and growth speed to your preferences.
Animation Option 5: Rotation
- Add variable before the preload( ) function:
- Add a variable to store the rotation angle.
- Update the draw( ) function (after drawing the background map but before drawing the artifact image) to include:
- Increase the artifact angle
- Add a translate() function to move the origin to the center of your artifact (you will need to update the parameter to the x and y coordinates near the center of your image).
- Add a rotate() function to rotate the ice cream cone
let schoolMap;
let studentA_artifact;
let studentA_artifact_description = “One sentence describing the artifact.”;
let showText_artifact = false;

let studentA_artifact_angle = 0; //Variable to store angle of artifact image

function preload() {
  schoolMap = loadImage(‘bwmap.png’);
  studentA_artifact = loadImage(‘studentA_artifact.png’);
}

function setup() {
  createCanvas(schoolMap.width, schoolMap.height);
  textSize(16);
  textAlign(LEFT,TOP);
  textWrap(WORD);
  textFont(‘Comic Sans MS’);
}

function draw() {
  background(schoolMap);

  studentA_artifact_angle += 1;//add 1 to the angle
  translate(500, 300); //set the origin point to the x and y coordinates at the center of your artifact image
  rotate(radians(studentA_artifact_angle)); //convert degrees to radians and rotate the artifact.
  image(studentA_artifact, 400, 100, 75, 75);
 }

  if (showText_artifact){
    drawTextBox(100, 70, studentA_artifact_description);
}

function drawTextBox(x, y, description) {
  fill(0);
  rect(x, y, 180, 80);

  fill(255);
  text(description, x + 5, y + 5, 180, 80);
}

function mousePressed() { //Detect when artifact is clicked
    if (mouseX > 200 && mouseX < 275 && mouseY > 15 && mouseY <225){
       showText_artifact = true;
    }
}

function mouseReleased() {
     showText_artifact = false;
}
Test and Customize
- Run your code by pressing the play button in the p5.js Web Editor and verify that your artifact rotates.
- Customize the number you added to your artifact angle to your preferred rotation speed.
Activity 5: Merging Into One Shared Map (Teacher)
In this final lesson, we’ll collect and integrate all of the student-created artifacts into a single shared map.
Steps:
Step 1: Gather Student Sketches & Images
- Ask each student to submit:
- A link to their p5.js sketch
- The image file for the artifact they used, named with the specified naming convention (i.e. studentA_artifact.png)
Step 2: Set up a New Combined Project & Upload Images
- In p5.js, duplicate the Base Map Template you created in Lesson 1.
- Add all student images to the sketch using the “+” button next to your sketch files.
Step 3: Merge Variables
- At the start of your program, just below where you have the variable to store your background map image, add the variables to hold each students’ image (copied and pasted from their sketches).
- Next, add the variables to hold each students’ artifact description (copied and pasted from their sketches).
- After that, add the variables to hold the showText status for each student artifact image (copied and pasted from their sketches).
- Lastly, add each student’s individual variables needed for their artifact’s animation (copied and pasted from their sketches).
Step 4: Merge Preload Code
- Combine all loadImage() functions for the student artifact images (copied and pasted from their sketches) into the shared project’s preload( ) function.
Step 5: Merge Draw Code
- Combine all artifact animation code into one shared draw( ) function (copy and paste each student’s animation code and use commenting to label it).
Step 6: Merge Mouse Interaction Code
- Copy each student’s mousePressed() and mouseReleased() code.
- Combine the logic to check if the mouse is over each artifact.
Step 7: Test and Customize the Combined Project
- Run the sketch and ensure all artifacts are displayed in the correct location and size.
- Check that animations work as expected.
- Check that pop-up descriptions appear when clicking artifacts.
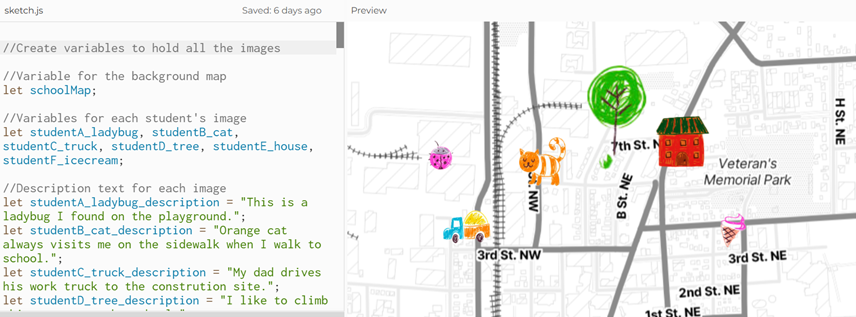
Sample merged code of six different students:
//Variable to store the background map
let schoolMap;

//Merged variables to store each student's artifact image
let studentA_ladybug, studentB_cat, studentC_truck, studentD_tree, studentE_house, studentF_icecream;

//Merged variables to store the description text for each student's artifact image
let studentA_ladybug_description = "This is a ladybug I found on the playground.";
let studentB_cat_description = "Orange cat always visits me on the sidewalk when I walk to school.";
let studentC_truck_description = "My dad drives his work truck to the construction site.";
let studentD_tree_description = "I like to climb this tree near the school.";
let studentE_house_description = "This is the house where I used to live, it's a different color now.";
let studentF_icecream_description = "My grandma and I like to go to the ice cream shop.";

//Merged variables to store whether the pop-up description text box should be visible.
let showTextCat = false;
let showTextHouse = false;
let showTextLadybug = false;
let showTextTruck = false;
let showTextTree = false;
let showTextIcecream = false;

//Variables for studentA_ladybug animation
let ladybugYPos = 150; //Starting Y position of ladybug
let speedLadybug = 0.1; //Speed of bounce
let directionLadybug = 1; //Direction of bounce

//Variables for StudentB_cat animation
let catXPos = 200;
let speedCat = 0.2;   //Speed for the cat
let directionCat = 1;  //Direction of cat movement

// Variables for StudentC_truck animation
let truckXPos = 100;  //Starting X position of the truck
let speedTruck = 1;   //Speed of truck's movement

// Variables for StudentD_tree animation
let treeSize = 1;  //Starting size of the tree
let sizeSpeed = 0.001;  //Tree growth speed

//Variables for StudentE_house animation
let houseColor = 0;  //Start with black
let colorSpeed = 0.5;  //Speed at which the color changes

//Variables for StudentF_icecream animation
let icecreamAngle = 0;  //Starting angle of ice cream cone

//Merged preload of all the images before the program runs
function preload() {
  schoolMap = loadImage('schoolmap.png');
  studentA_ladybug = loadImage('ladybug.png');
  studentB_cat = loadImage('cat.png');
  studentC_truck = loadImage('truck.png');
  studentD_tree = loadImage('tree.png');
  studentE_house = loadImage('house.png');
  studentF_icecream = loadImage('icecream.png');
}

//Set up the canvas and text properties
function setup() {
  createCanvas(schoolMap.width, schoolMap.height);
  textSize(16);
  textAlign(LEFT,TOP);
  textWrap(WORD);
  textFont(‘Comic Sans MS’);
}

//Draw the map and merged images

function draw() {
  background(schoolMap);

  //StudentA_ladybug - Bouncing Animation
  ladybugYPos += speedLadybug * directionLadybug; //Move the ladybug up/down
  if (ladybugYPos >= 180 || ladybugYPos <= 120) {
    directionLadybug *= -1; //Reverse bounce direction
  }
  image(studentA_ladybug, 100, ladybugYPos, 50, 50); //Draw the ladybug image - image,x,y,w,h

  //StudentB_cat - move left to right
  catXPos += speedCat * directionCat; //Move the cat
  if (catXPos >= 225 || catXPos <= 175) {
    directionCat *= -1; //Reverse direction when limits are reached
  }
  image(studentB_cat, catXPos, 150, 75, 75);  //Draw the cat image image, x, y, w, h

  // StudentC_truck - Move left to right
  truckXPos += speedTruck; //Move the truck left or right
  if (truckXPos >= 125 || truckXPos <= 75) {
    speedTruck *= -1; //Reverse movement direction
  }
  image(studentC_truck, truckXPos, 250, 75, 50); //Draw the truck image - image, x, y, w, h

  //StudentE_house - color change animation
  houseColor += colorSpeed; //Change the color value over time
  if (houseColor >= 255 || houseColor <= 0) {
    colorSpeed *= -1;  //Reverse color change direction
  }
  tint(houseColor, 100, 255 - houseColor); //Apply color tint to the house
  image(studentE_house, 400, 100, 100, 100);  //Draw the house image - image, x, y, w, h
  noTint();//Restore tint to original colors

  //StudentD_tree - grow and shrink
  treeSize += sizeSpeed; //Increase or decrease tree size
  if (treeSize >= 1.1 || treeSize <= 0.8) {
    sizeSpeed *= -1;  //Reverse growth direction
  }
  image(studentD_tree, 300, 50, 100 * treeSize, 150 * treeSize);  //Draw the tree image - image, x, y, w, h

  //StudentF_iceceam - rotating animation
  icecreamAngle += 1; //Increase the angle to rotate the ice cream cone
  translate(500, 300); //Move the origin to the center of the ice cream
  rotate(radians(icecreamAngle));  //Rotate the ice cream cone
  image(studentF_icecream, -25, -50, 50, 50);  //Draw the ice cream image - image, x, y, w, h

  //Merged conditionals to check to see if an image is being clicked and if so, draw the description near that artifact
    if (showTextLadybug) {
    drawTextBox(100, 70, studentA_ladybug_description); //Text box for ladybug near the image
  }
  if (showTextCat) {
    drawTextBox(catXPos, 230, studentB_cat_description); //Text box for cat near the image
  }
  if (showTextTruck) {
  drawTextBox(truckXPos, 310, studentC_truck_description); //Text box for truck near the image
  }
  if (showTextTree) {
  drawTextBox(300, 210, studentD_tree_description); //Text box for tree near the image
  }
  if (showTextHouse) {
    drawTextBox(400, 210, studentE_house_description); //Text box for house near the image
  }
  if (showTextIcecream) {
    drawTextBox(500, 350, studentF_icecream_description); //Text box for ice cream near the image
  }
}

//Function to draw a text box near the image
function drawTextBox(x, y, description) {
  fill(0);
  rect(x, y, 180, 80);

  fill(255);
  text(description, x + 5, y + 5, 180, 80);
}

//Merged mouse interaction - while image is clicked, show text box

function mousePressed() {
  //Detect if the mouse is over each image and show its text box when clicked
  if (mouseX > 100 && mouseX < 150 && mouseY > ladybugYPos && mouseY < ladybugYPos + 50) {
    showTextLadybug = true;
  } else if (mouseX > catXPos && mouseX < catXPos + 75 && mouseY > 150 && mouseY < 225) {
    showTextCat = true;
  } else if (mouseX > truckXPos && mouseX < truckXPos + 75 && mouseY > 250 && mouseY < 300) {
    showTextTruck = true;
  } else if (mouseX > 300 && mouseX < 400 && mouseY > 50 && mouseY < 200) {
    showTextTree = true;
  } else if (mouseX > 400 && mouseX < 500 && mouseY > 100 && mouseY < 200) {
    showTextHouse = true;
  } else if (mouseX > 475 && mouseX < 525 && mouseY > 275 && mouseY < 325) {
    showTextIcecream = true;
  }
}

function mouseReleased() {
  //Merged to hide all text boxes when the mouse is released
  showTextLadybug = false;
  showTextCat = false;
  showTextTruck = false;
  showTextTree = false;
  showTextHouse = false;
  showTextIcecream = false;
}
Step 8: Debug and Adjust
- If something isn’t working:
- Check for typos in variable names.
- Verify that all image file paths are correct.
- Ensure that no two variables have the same name.
- You will likely need to do some tinkering and make some adjustments to artifact image sizes, positions, and animation boundaries, and mousePressed areas to ensure there are no conflicts between artifact artifacts.
Applications
Once you get the hang of creating participatory maps in p5.js, there are many opportunities to apply participatory cartography concepts across the curriculum:
- Mapping historical events that happened in your local area, incorporating photos, descriptions, and even sound recordings.
- Documenting flora and fauna observations in a specific area (trees, birds, invasive species, etc.).
- Creating maps of key settings in a novel or short story long with interpretations.
- Mapping local businesses and cultural centers associated with a target language.
- Creating maps of important places to students in other places they have lived.
Assessment
This project gives students the opportunity to practice many computer science concepts, including variables, data types, functions, control structures, coordinate systems, image manipulation, animation, event handling, interactivity, code organization, debugging, collaboration, creativity, and design.
Sample computer science assessment criteria could include:
- Accuracy: Does the artifact appear on the map in the intended position? Does the animation work as expected?
- Creativity: Are the artifact image and description meaningful and engaging?
- Code Quality: Is the code organized and readable? Are variables and functions used appropriately?
- Debugging: How well did the student identify and fix problems in their code?
- Collaboration: Did the student contribute effectively to the shared map?